Corporate Insights

Beyond the Screen: The New Language of Corporate Analytics.

Data is static; insight is movement. We explore how modern organizations translate raw performance analytics into a shared cultural vocabulary that drives collective action.

"The most effective corporate dashboards aren't built for monitors; they are built for the conversations that happen after the meeting."
Future of corporate workspace visualization

Educational content at Minavq focuses on the spatial and social dimensions of information—how business metrics occupy physical and digital environments to foster transparency.

Core Curriculum
Long-Form Essay

The Cognitive Load of KPI Tracking

Why more data often leads to less clarity. We break down the psychological barriers to effective KPIs tracking and how to design corporate dashboards that prioritize significant signals over ambient noise. Discover how to prune your metrics to the essentials.

Grid Logic in Dashboards

A technical deep-dive into the spatial arrangement of business metrics to ensure high-speed readability across departments.

Join the Seminar
Quick Read

Latency & Decision Making

How real-time performance analytics actually changes executive behavior, for better or worse.

Read Article
Corporate analytics interface

The Taxonomy of Modern Performance

Our updated guide on classifying performance analytics into actionable categories. From trailing indicators to predictive modeling, understand the hierarchy.

Download Guide

Institutional Knowledge Base

We maintain a rigorous archive of educational content designed for teams transitioning into data-first operational models. This is where we bridge the gap between academic theory and corporate reality.

Metric Integrity Standards

Foundational documentation on maintaining data hygiene across global divisions.

The Framework Navigator

A comparative analysis of disparate KPI methodologies and their specific industry fits.

Analytic Faculty Program

Structured learning paths for internal champions of corporate analytics.

Where to Begin?

If you are new to the Minavq ecosystem, we recommend following this verified introductory sequence:

  • Understanding Business Metrics Archetypes
  • The Psychology of Performance Analytics
  • First Steps in KPI Framework Selection
Inquire About Workshops

Tokyo Studio: Field Notes

Observations from our headquarters in Chiyoda City on how local tech giants are redefining information architecture.

View from Minavq Tokyo office

LOC: MARUNOUCHI // OBS: 2026-02-15
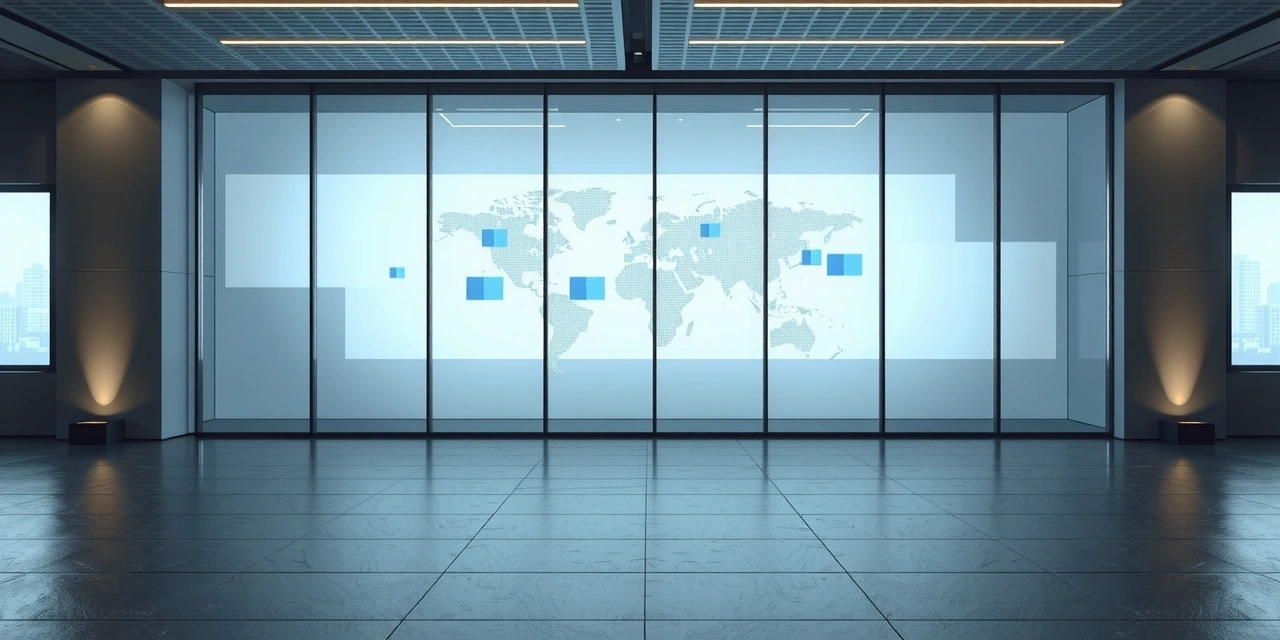
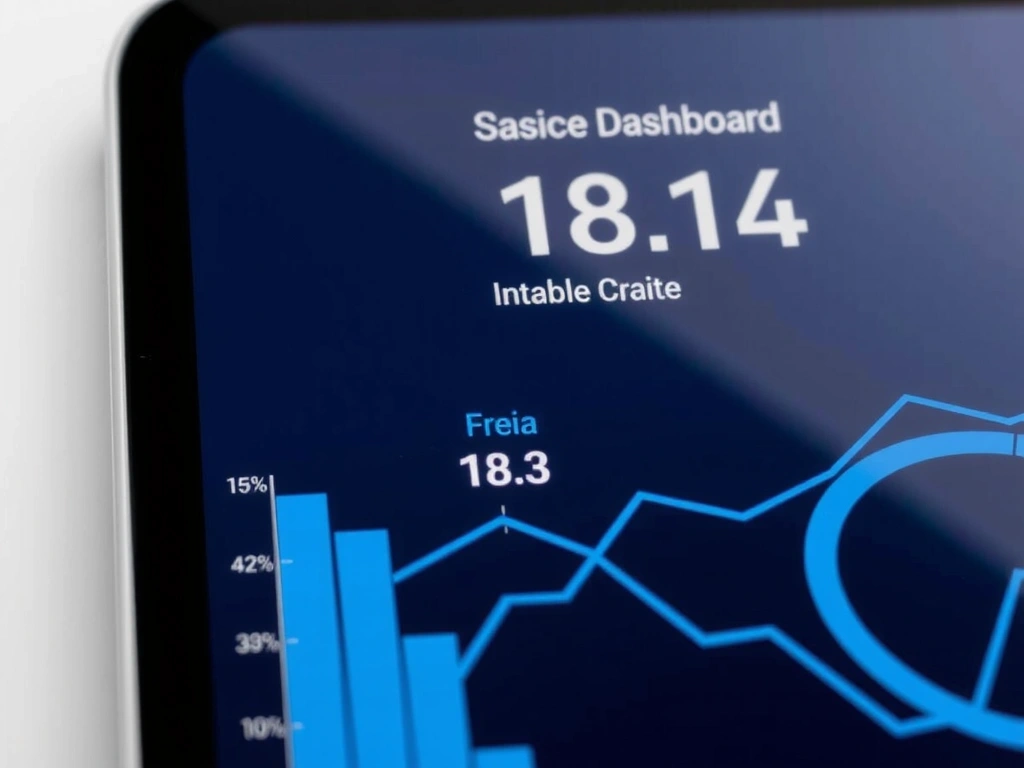
Density Paradigms

"Walking through the business districts here, we see a shift away from 'the dashboard as a tool' toward 'the dashboard as an environment'. Screens are no longer secondary devices; they are the primary architectural feature. This forces a change in how we teach business metrics—they must be readable at a glance from 20 feet away."

The Quietness of Accuracy

"The best analytics we see in Japanese corporate culture don't shout. They whisper. Red-yellow-green status indicators are being replaced by subtle haptic and visual gradients that reflect the complexity of modern markets. Educational content needs to evolve to explain these nuances."

Symbolic corporate progress metaphor

REF: STRUCTURE // VOL: 04

Educational Commitment

Minavq is dedicated to raising the standard of analytical literacy in the modern enterprise. All materials provided on this platform are for informational and educational purposes only. We do not provide specialized business consulting without a direct engagement.

Disclaimer: All materials are provided for informational and educational purposes only.
Tokyo, Chiyoda City, Marunouchi 1-1-1 +81 3 4520 7812 [email protected]